
Tree Plantation Survival Rates in India: Why Most Corporate Drives Fail, and What Geo-Tagged Monitoring Changes
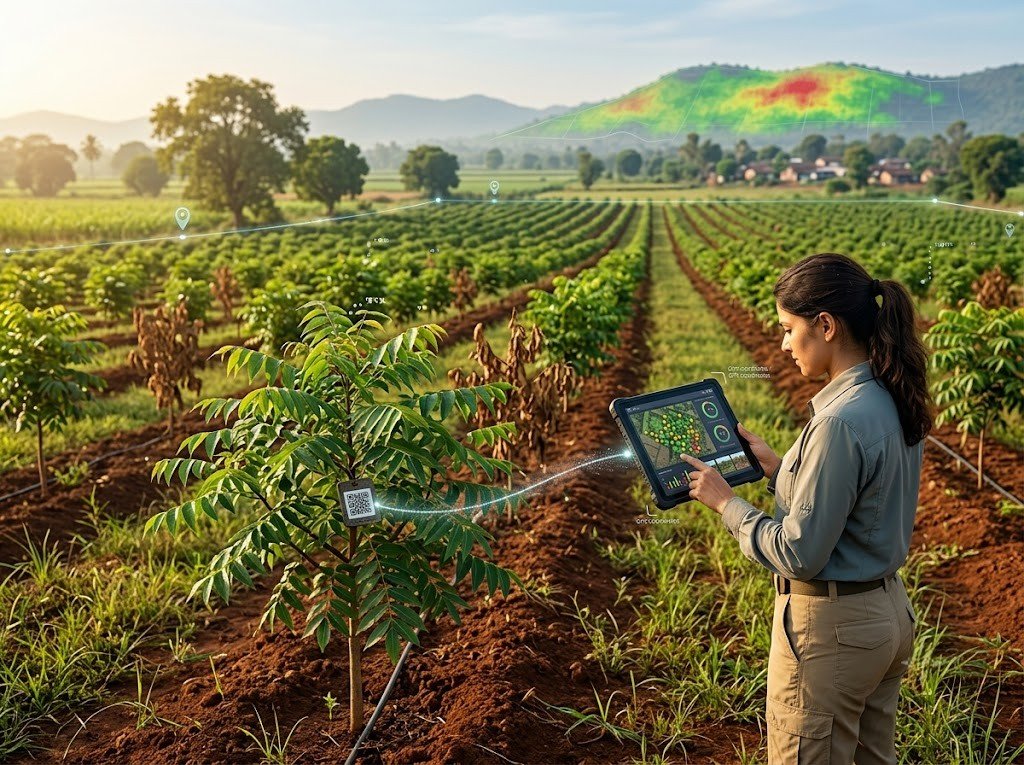
There is a specific kind of photograph that circulates every June. A row of people in branded t-shirts, spades held at an angle, a line ofsaplings in fresh pits, a banner with a number on it. The number is always the count of saplings planted. It is never thecount of trees alive. That gap — between planted and alive — is the entire subject of thisarticle. Because it is not a small gap. Survival rates for Indian plantationdrives, where they have been independently audited at all, frequentlyland somewhere between 30% and 60% at the three-year mark, and theprojects that do worse are usually the ones that never measured. The good news: almost every cause of mortality is known, predictable andfixable. What has been missing is not the knowledge. It is the accountabilitystructure that makes anyone act on it. WHAT “SURVIVAL RATE” ACTUALLY MEANS — AND WHY THE NUMBER IS USUALLYMEANINGLESS Before diagnosing the problem, fix the metric. A survival rate quoted without three qualifiers is not data. Survival at 3 months is a nursery statistic. Survival at 12 months tells you whether the sapling made it through onedry season. Survival at 3 years tells you whether you have a tree. Survival at 5 years tells you whether you have a forest. These are wildly different numbers for the same plot, and unscrupulousreporting picks the earliest one. The regulatory direction has settled this argument. The Green Credit Programme’s revised modalities, notified in August2025, require a minimum of five years of restoration activity beforecredits are issued, calculated on vegetation status including change incanopy density after achieving a minimum of 40% and the number ofsurviving trees. Five years and canopy — not saplings and photographs. Did someone count every tree, or sample plots and extrapolate? Both are legitimate. Census is honest at small scale; stratified random sampling is standardabove a few thousand trees. What is not legitimate is walking the easiest edge of the plot andgeneralising. The methodology must be stated. A sapling with green leaves and a sapling that has established a rootsystem deep enough to survive the next summer are different things. Serious protocols record height and, once trees are large enough,diameter at breast height — not just presence. If a plantation report gives you a percentage without these three, it ismarketing. WHY THEY DIE: THE EIGHT FAILURE MODES The single largest cause. Species selection driven by nursery availability or cost per saplingrather than by soil, rainfall and local ecology. Site-species matching means matching the plant to: A species that thrives in coastal Maharashtra will not survive on alateritic plateau in Jharkhand, however cheap the sapling was. Native species are usually the answer — not for ideological reasons, butbecause they are already adapted to local rainfall patterns, soilchemistry and pest pressure, and they support existing pollinator andbird populations. Exotic fast-growers look impressive at year two and frequently leave youwith a monoculture that provides poor biodiversity value and, on somesites, depletes groundwater. In most of India, the planting window is the onset of the monsoon. Planting into the first reliable rains gives the sapling a full wetseason to establish roots before facing its first dry period. Plant in October and you have handed a fresh transplant six months ofdrought. Plantation drives scheduled around World Environment Day (5 June),corporate calendars, or the visiting dignitary’s availability ratherthan the actual local monsoon onset kill saplings on the calendar alone. Pits dug too small, too shallow, or backfilled with the same compactedsoil that was removed. A pit should be dug well in advance where possible, allowing weathering,and backfilled with a mix of topsoil, organic matter and, whereindicated, soil amendments. In hard or rocky substrate, pit dimensions matter more, not less. A tall sapling in a small polybag is often root-bound — the root systemhas coiled inside the container and will not spread properly aftertransplant. Root-bound stock has high early mortality that looks like drought damageand gets blamed on weather. Stock should be assessed on root-to-shoot balance and hardening-off, noton height. This is the structural failure. Budgets are almost always built around the planting event. Watering through the first two dry seasons, weeding cycles, replacementof casualties, protection maintenance and soil work in years two andthree are where survival is actually determined — and where nobodyallocated money. A useful discipline: If the maintenance budget is less than the planting budget, the projectis designed to fail. Grazing is the second-largest cause of mortality in most Indianlandscapes. Free-ranging cattle and goats will remove a plantation in a fortnight. Tree guards, trench-and-mound, or live fencing add cost — and skippingthem makes the entire spend a donation to livestock. Trees planted by outsiders, on land nobody local benefits from, get noinformal protection. Trees that a village, a farmer or a school has a stake in acquire ahundred unpaid guardians. This is not sentiment — it is the cheapest protection mechanismavailable, and it is why agroforestry models with an income streamattached consistently outperform pure plantation on survival. The failure that hides all the others. If nobody measures survival at 12 and 36 months, nobody knows whichspecies failed, which site conditions caused it, or which contractorunder-delivered. The mistakes repeat, at scale, every year. THE MEASUREMENT STACK: WHAT “GEO-TAGGED” SHOULD ACTUALLY MEAN “Geo-tagged plantation” has become a marketing phrase. Here is what a real monitoring architecture contains. LAYER 1 — SPATIAL IDENTITY Every plot gets a boundary polygon captured by GPS. Within it, each sapling or each planting row gets a coordinate with anaccuracy figure recorded. Consumer smartphone GPS delivers roughly 3–5 metre accuracy in openconditions, which is adequate at plot level. Sub-metre sapling-level identification needs either differential GPS ora physical identifier tied to a coordinate. That physical identifier is what a QR code does. Not magic — just a durable, scannable link between a specific tree and aspecific database record, so that a field auditor two years later isverifying this tree, not a tree in roughly this area. LAYER 2 — BASELINE Date-stamped, georeferenced photographs of the site before planting. Soil condition, existing