
There is a specific kind of photograph that circulates every June.
A row of people in branded t-shirts, spades held at an angle, a line of
saplings in fresh pits, a banner with a number on it.
The number is always the count of saplings planted. It is never the
count of trees alive.
That gap — between planted and alive — is the entire subject of this
article.
Because it is not a small gap. Survival rates for Indian plantation
drives, where they have been independently audited at all, frequently
land somewhere between 30% and 60% at the three-year mark, and the
projects that do worse are usually the ones that never measured.
The good news: almost every cause of mortality is known, predictable and
fixable.
What has been missing is not the knowledge. It is the accountability
structure that makes anyone act on it.
WHAT “SURVIVAL RATE” ACTUALLY MEANS — AND WHY THE NUMBER IS USUALLY
MEANINGLESS
Before diagnosing the problem, fix the metric.
A survival rate quoted without three qualifiers is not data.
- THE MEASUREMENT WINDOW
Survival at 3 months is a nursery statistic.
Survival at 12 months tells you whether the sapling made it through one
dry season.
Survival at 3 years tells you whether you have a tree.
Survival at 5 years tells you whether you have a forest.
These are wildly different numbers for the same plot, and unscrupulous
reporting picks the earliest one.
The regulatory direction has settled this argument.
The Green Credit Programme’s revised modalities, notified in August
2025, require a minimum of five years of restoration activity before
credits are issued, calculated on vegetation status including change in
canopy density after achieving a minimum of 40% and the number of
surviving trees.
Five years and canopy — not saplings and photographs.
- THE SAMPLING METHOD
Did someone count every tree, or sample plots and extrapolate?
Both are legitimate.
Census is honest at small scale; stratified random sampling is standard
above a few thousand trees.
What is not legitimate is walking the easiest edge of the plot and
generalising.
The methodology must be stated.
- THE DEFINITION OF “ALIVE”
A sapling with green leaves and a sapling that has established a root
system deep enough to survive the next summer are different things.
Serious protocols record height and, once trees are large enough,
diameter at breast height — not just presence.
If a plantation report gives you a percentage without these three, it is
marketing.
WHY THEY DIE: THE EIGHT FAILURE MODES
- WRONG SPECIES FOR THE SITE
The single largest cause.
Species selection driven by nursery availability or cost per sapling
rather than by soil, rainfall and local ecology.
Site-species matching means matching the plant to:
- Soil type and pH • Annual rainfall and its distribution • Water table
depth • Slope and drainage • Existing vegetation
A species that thrives in coastal Maharashtra will not survive on a
lateritic plateau in Jharkhand, however cheap the sapling was.
Native species are usually the answer — not for ideological reasons, but
because they are already adapted to local rainfall patterns, soil
chemistry and pest pressure, and they support existing pollinator and
bird populations.
Exotic fast-growers look impressive at year two and frequently leave you
with a monoculture that provides poor biodiversity value and, on some
sites, depletes groundwater.
- WRONG PLANTING WINDOW
In most of India, the planting window is the onset of the monsoon.
Planting into the first reliable rains gives the sapling a full wet
season to establish roots before facing its first dry period.
Plant in October and you have handed a fresh transplant six months of
drought.
Plantation drives scheduled around World Environment Day (5 June),
corporate calendars, or the visiting dignitary’s availability rather
than the actual local monsoon onset kill saplings on the calendar alone.
- POOR PIT PREPARATION
Pits dug too small, too shallow, or backfilled with the same compacted
soil that was removed.
A pit should be dug well in advance where possible, allowing weathering,
and backfilled with a mix of topsoil, organic matter and, where
indicated, soil amendments.
In hard or rocky substrate, pit dimensions matter more, not less.
- BAD PLANTING STOCK
A tall sapling in a small polybag is often root-bound — the root system
has coiled inside the container and will not spread properly after
transplant.
Root-bound stock has high early mortality that looks like drought damage
and gets blamed on weather.
Stock should be assessed on root-to-shoot balance and hardening-off, not
on height.
- NO AFTERCARE BUDGET
This is the structural failure.
Budgets are almost always built around the planting event.
Watering through the first two dry seasons, weeding cycles, replacement
of casualties, protection maintenance and soil work in years two and
three are where survival is actually determined — and where nobody
allocated money.
A useful discipline:
If the maintenance budget is less than the planting budget, the project
is designed to fail.
- NO PROTECTION
Grazing is the second-largest cause of mortality in most Indian
landscapes.
Free-ranging cattle and goats will remove a plantation in a fortnight.
Tree guards, trench-and-mound, or live fencing add cost — and skipping
them makes the entire spend a donation to livestock.
- NO LOCAL OWNERSHIP
Trees planted by outsiders, on land nobody local benefits from, get no
informal protection.
Trees that a village, a farmer or a school has a stake in acquire a
hundred unpaid guardians.
This is not sentiment — it is the cheapest protection mechanism
available, and it is why agroforestry models with an income stream
attached consistently outperform pure plantation on survival.
- NO MEASUREMENT
The failure that hides all the others.
If nobody measures survival at 12 and 36 months, nobody knows which
species failed, which site conditions caused it, or which contractor
under-delivered.
The mistakes repeat, at scale, every year.
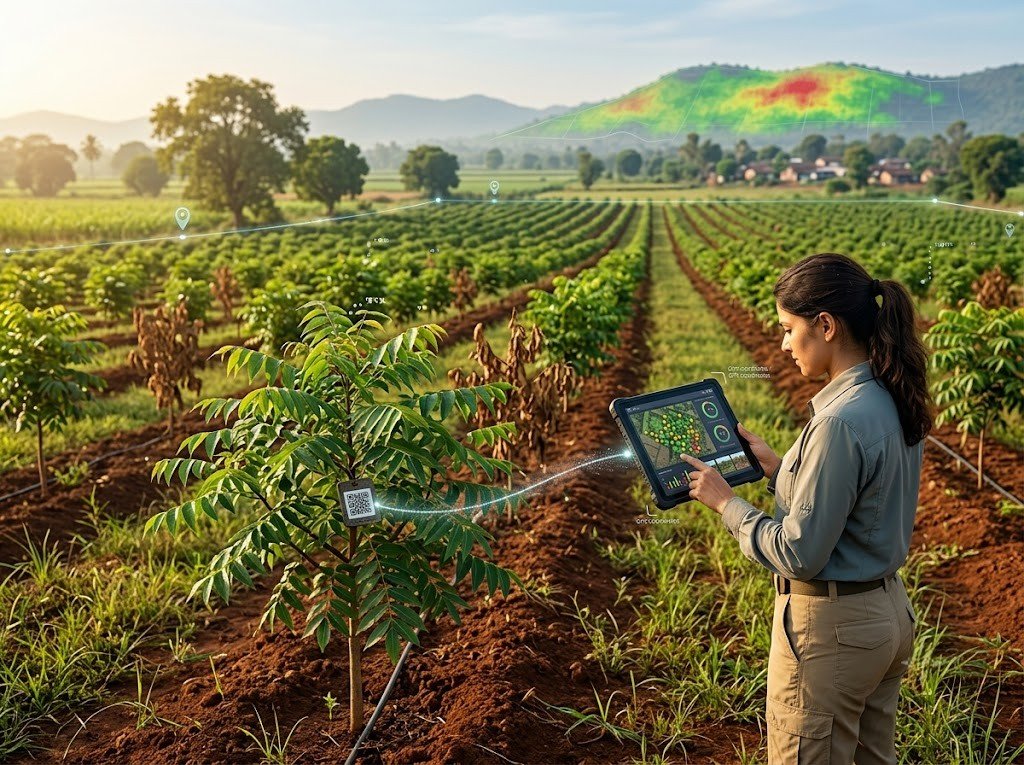
THE MEASUREMENT STACK: WHAT “GEO-TAGGED” SHOULD ACTUALLY MEAN
“Geo-tagged plantation” has become a marketing phrase.
Here is what a real monitoring architecture contains.
LAYER 1 — SPATIAL IDENTITY
Every plot gets a boundary polygon captured by GPS.
Within it, each sapling or each planting row gets a coordinate with an
accuracy figure recorded.
Consumer smartphone GPS delivers roughly 3–5 metre accuracy in open
conditions, which is adequate at plot level.
Sub-metre sapling-level identification needs either differential GPS or
a physical identifier tied to a coordinate.
That physical identifier is what a QR code does.
Not magic — just a durable, scannable link between a specific tree and a
specific database record, so that a field auditor two years later is
verifying this tree, not a tree in roughly this area.
LAYER 2 — BASELINE
Date-stamped, georeferenced photographs of the site before planting.
Soil condition, existing vegetation, land use.
This is the layer everyone skips and nobody can recreate.
Without a baseline, you cannot demonstrate change, which means you
cannot substantiate impact — for CSR impact assessment, for a future
carbon PDD, or for a board that asks what the money bought.
LAYER 3 — PLANTING RECORD
Record:
- Species by botanical name • Count • Source nursery • Sapling age and
height at planting • Planting date • Pit specification • Name of the
person or team responsible
This turns a plantation into a dataset with accountability attached.
LAYER 4 — PERIODIC SURVIVAL AUDIT
Field verification at defined intervals — commonly 3, 6, 12, 24, 36 and
60 months.
Recorded per tree or per sampled plot:
- Alive/dead • Height • Health condition • Cause of loss where
identifiable
Photographs should be taken from fixed points so images are comparable
over time rather than a fresh set of pretty pictures each visit.
Cause-of-loss coding is the most underrated field in the whole system.
It is the difference between:
“We lost 22%”
and
“We lost 22%, overwhelmingly to grazing on the northern boundary, and
here is what it costs to fence it.”
LAYER 5 — REMOTE SENSING
Satellite-based vegetation indices, primarily NDVI, give you canopy
trend over the whole site without a field visit.
Freely available Sentinel-2 imagery at 10-metre resolution works well
for plots above roughly 5 hectares.
Smaller plots need higher-resolution commercial imagery or drone survey.
Remote sensing does not replace ground truthing — it cannot count
individual trees or tell you whether the green pixel is your plantation
or the weeds around it.
What it does exceptionally well is flag anomalies between site visits,
so a failing block gets attention in month eight rather than at the
annual audit.
LAYER 6 — REPORTING
A dashboard is not the deliverable.
The deliverable is a report that a CSR head can hand to an auditor, an
impact assessor or a board, containing:
- Methodology used • Sampling intensity • Survival by species and by
block • Canopy trend • Losses with causes • Corrective action taken •
Cost per surviving tree
Cost per surviving tree, incidentally, is the only plantation metric
worth benchmarking.
Cost per sapling planted rewards exactly the wrong behaviour.
CONTRACTING FOR SURVIVAL, NOT FOR SAPLINGS
The technology is the easy part.
The genuinely hard change is commercial.
Almost every plantation contract in India pays on saplings planted.
That contract structure guarantees the outcome it produces — the
vendor’s incentive ends the moment the last pit is filled.
A survival-linked structure looks different:
TRANCHE 1 — PLANTING
A portion released on verified planting against species and count
specification.
TRANCHE 2 — 12 MONTHS
Released against an independently verified survival threshold.
TRANCHE 3 — 36 MONTHS
Released against survival and growth thresholds.
REPLACEMENT OBLIGATION
Casualties below the threshold replaced at the vendor’s cost, within the
next planting window.
MAINTENANCE RETAINER
Funded separately and explicitly, not assumed within the per-sapling
rate.
SET THE THRESHOLDS HONESTLY
Demanding 100% survival produces falsified reports, not living trees.
A well-designed project on a reasonable site should target 80–85% at 12
months and 70–75% at 36 months, with the gap closed by replacement
planting.
Any vendor promising 95%+ without a replacement clause is telling you
what you want to hear.
Structure it this way and the incentives finally point in the same
direction as the trees.
WHAT THIS UNLOCKS DOWNSTREAM
Survival data is not just an operational nicety.
It is the input to everything else you might want to claim.
FOR CSR
Independent impact assessment is mandatory for companies with average
CSR obligation of ₹10 crore or more, and project-level disclosure is
required in Form CSR-2.
Survival data with a stated methodology is what makes that filing
defensible.
FOR GREEN CREDITS
The revised Green Credit Programme rules calculate credits on vegetation
status — change in canopy density after achieving a minimum 40% — and
surviving tree count, over a minimum five-year period.
Without five years of survival records, there is nothing to submit.
FOR CARBON
Any future forestry methodology under India’s carbon market will require
baseline, measurability against an approved protocol, permanence, and
third-party verification.
Every one of those depends on data collected from day one.
FOR THE BOARD
The question is shifting from:
“How many did we plant?”
to:
“How many are alive, and what did each one cost?”
The organisations that can answer that will keep their budgets.
The ones that can’t will find plantation quietly reclassified as a
marketing expense.
THE UNCOMFORTABLE SUMMARY
India does not have a tree planting problem.
Hundreds of millions of saplings go into the ground here every year.
India has a tree keeping problem — and it persists because the entire
system, from budgeting to contracting to reporting to publicity, is
optimised around the day of the event rather than the decade that
follows.
Fixing it does not require new technology.
GPS, QR codes and satellite vegetation indices are all mature and cheap.
It requires deciding that the number worth reporting is the one measured
in year three, and then building the contracts, budgets and audits that
make that number real.
The trees, given half a chance, do the rest themselves.
CALL TO ACTION
Want to see what tree-level tracking actually looks like in the field?
Every sapling we plant carries a QR code and a GPS coordinate, with
survival audits reported through to year five.
See our work → /our-work/
FREQUENTLY ASKED QUESTIONS
Q: What is a good tree plantation survival rate in India?
A: A well-designed project on a suitable site should target roughly
80–85% survival at 12 months and 70–75% at 36 months, with losses closed
through replacement planting.
Rates below 50% at three years indicate a structural problem in species
selection, aftercare or protection, not bad luck.
Q: Why do so many planted saplings die?
A: The most common causes are species unsuited to the site, planting
outside the monsoon window, inadequate pit preparation, root-bound
nursery stock, no aftercare budget for the first two dry seasons,
grazing damage, absence of local ownership, and — underlying all of it —
no measurement, so the same errors repeat annually.
Q: What does geo-tagging a tree actually involve?
A: Capturing a GPS coordinate for each sapling or planting block,
linking it to a database record containing species, planting date,
source nursery and responsible team, and attaching a durable physical
identifier such as a QR code so field auditors can verify the specific
tree on later visits.
Q: How is tree plantation survival rate measured?
A: By field verification at defined intervals — commonly 3, 6, 12, 24,
36 and 60 months — using either a full census or stratified random
sampling, recording each tree as alive or dead along with height, health
condition and cause of loss.
The measurement window and sampling method must both be stated for the
figure to be meaningful.
Q: Can satellite imagery monitor a tree plantation?
A: Yes, for canopy trend.
Vegetation indices such as NDVI derived from Sentinel-2 imagery at
10-metre resolution work well for plots above roughly 5 hectares.
Satellite data cannot count individual trees or distinguish plantation
from surrounding vegetation, so it supplements rather than replaces
ground verification.
Q: How long should a corporate plantation project be funded for?
A: At least three years, and preferably five.
Survival is determined in years two and three, and the revised Green
Credit Programme rules require a minimum of five years of restoration
activity with 40% canopy density before credits are issued.
A one-year project reports success at the exact point when the data is
least meaningful.
Q: What is canopy density and why does it matter?
A: Canopy density is the proportion of ground covered by tree crowns
when viewed from above.
It matters because it measures ecological outcome rather than input — a
40% minimum canopy density is the threshold used under India’s revised
Green Credit Programme rules for issuing credits from tree plantation.